GDPa Components
24 Component Indices
5 Related Indices
10 Regions
223 Countries and Principalities
Spotlight on Unemployment Rates
Components

Component Indices
- Annual deforestation (% change)
- Bird species, threatened
- Bird Species, Total
- CO2 emissions (metric tons per capita)
- Domestic general government health expenditure (% of GDP)
- Fish species, threatened
- Fish Species, Total
- GDP per capita (current US$)
- Informal employment, male (% of total non-agricultural employment)
- Labor force participation rate, total (% of total population ages 15-64)
- Literacy rate, adult total (% of people ages 15 and above)
- Mammal species, threatened
- Mammal Species, Total
- Mean nominal monthly earnings
- Minimum monthly wage ($USD PPP)
- Minimum Wage % of Average Wage
- Mortality rate attributed to household and ambient air pollution, age-standardized (per 100,000 population)
- Mortality rate attributed to unsafe water, unsafe sanitation and lack of hygiene (per 100,000 population)
- Plant species (higher), threatened
- Plant Species, Total
- Population ages 15-64 (% of total population)
- Population, total
- Self-employed, total (% of total employment)
- Unemployment, total (% of total labor force)
Related Indices
- % of Wage Earners Low Wage
- Final consumption expenditure (current US$)
- Incarceration Rate
- Population ages 65 and above (% of total population)
- Social contributions (% of revenue)
Regions
Countries and Principalities
- Afghanistan
- Albania
- Algeria
- American Samoa
- Andorra
- Angola
- Antigua and Barbuda
- Argentina
- Armenia
- Aruba
- Australia
- Austria
- Azerbaijan
- Bahamas
- Bahrain
- Bangladesh
- Barbados
- Belarus
- Belgium
- Belize
- Benin
- Bermuda
- Bhutan
- Bolivia
- Bosnia and Herzegovina
- Botswana
- Brazil
- British Virgin Islands
- Brunei Darussalam
- Bulgaria
- Burkina Faso
- Burundi
- Cabo Verde
- Cambodia
- Cameroon
- Canada
- Cape Verde
- Cayman Islands
- Central African Republic
- Chad
- Channel Islands
- Chile
- China
- Colombia
- Comoros
- Congo-Democratic
- Congo-Republic
- Costa Rica
- Cote d’Ivoire
- Croatia
- Cuba
- Curacao
- Cyprus
- Czech Republic
- Czechia
- Denmark
- Djibouti
- Dominica
- Dominican Republic
- East Timor (Timor-Leste)
- Ecuador
- Egypt
- El Salvador
- Equatorial Guinea
- Eritrea
- Estonia
- Eswatini
- Ethiopia
- Faroe Islands
- Fiji
- Finland
- France
- French Polynesia
- Gabon
- Gambia
- Georgia
- Germany
- Ghana
- Gibraltar
- Greece
- Greenland
- Grenada
- Guam
- Guatemala
- Guinea
- Guinea-Bissau
- Guyana
- Haiti
- Honduras
- Hong Kong SAR, China
- Hungary
- Iceland
- India
- Indonesia
- Iran
- Iraq
- Ireland
- Isle of Man
- Israel
- Italy
- Jamaica
- Japan
- Jordan
- Kazakhstan
- Kenya
- Kiribati
- Korea, Dem. People’s Rep.
- Korea, Rep.
- Kosovo
- Kuwait
- Kyrgyzstan
- Laos
- Latvia
- Lebanon
- Lesotho
- Liberia
- Libya
- Liechtenstein
- Lithuania
- Luxembourg
- Macao SAR, China
- Madagascar
- Malawi
- Malaysia
- Maldives
- Mali
- Malta
- Marshall Islands
- Mauritania
- Mauritius
- Mexico
- Micronesia, Federated States of
- Moldova
- Monaco
- Mongolia
- Montenegro
- Morocco
- Mozambique
- Myanmar
- Namibia
- Nauru
- Nepal
- Netherlands
- New Caledonia
- New Zealand
- Nicaragua
- Niger
- Nigeria
- North Korea
- North Macedonia
- Northern Mariana Islands
- Norway
- Oman
- Pakistan
- Palau
- Panama
- Papua New Guinea
- Paraguay
- Peru
- Philippines
- Poland
- Portugal
- Puerto Rico
- Qatar
- Romania
- Russian Federation
- Rwanda
- Samoa
- San Marino
- São Tomé and Príncipe
- Saudi Arabia
- Senegal
- Serbia
- Seychelles
- Sierra Leone
- Singapore
- Sint Maarten (Dutch part)
- Slovakia
- Slovenia
- Solomon Islands
- Somalia
- South Africa
- South Korea
- South Sudan
- Spain
- Sri Lanka
- Kitts and Nevis
- Lucia
- Martin (French part)
- Vincent and the Grenadines
- Sudan
- Suriname
- Sweden
- Switzerland
- Syrian Arab Republic
- Tajikistan
- Tanzania
- Thailand
- Timor-Leste
- Togo
- Tonga
- Trinidad and Tobago
- Tunisia
- Turkey
- Turkmenistan
- Turks and Caicos Islands
- Tuvalu
- Uganda
- Ukraine
- United Arab Emirates
- United Kingdom
- United States
- Uruguay
- Uzbekistan
- Vanuatu
- Venezuela
- Vietnam
- Virgin Islands, British
- Virgin Islands, U.S.
- West Bank and Gaza
- Yemen
- Zambia
- Zimbabwe
About Unemployment Rates
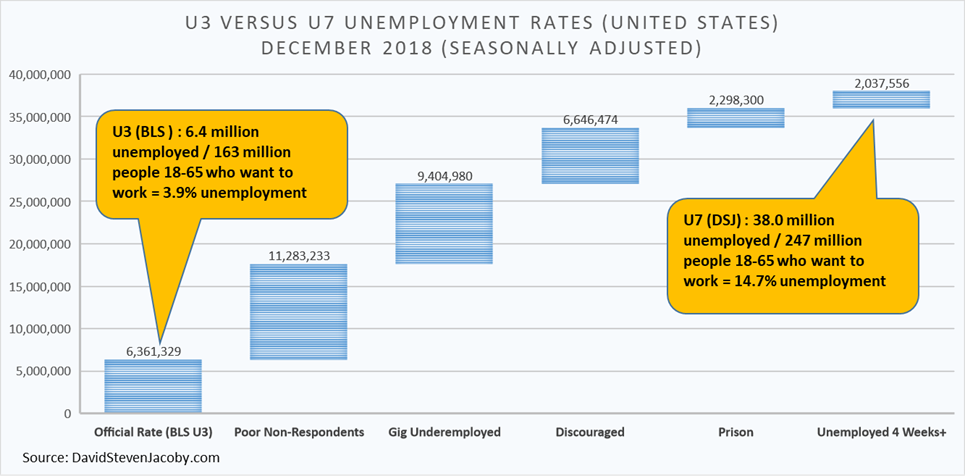
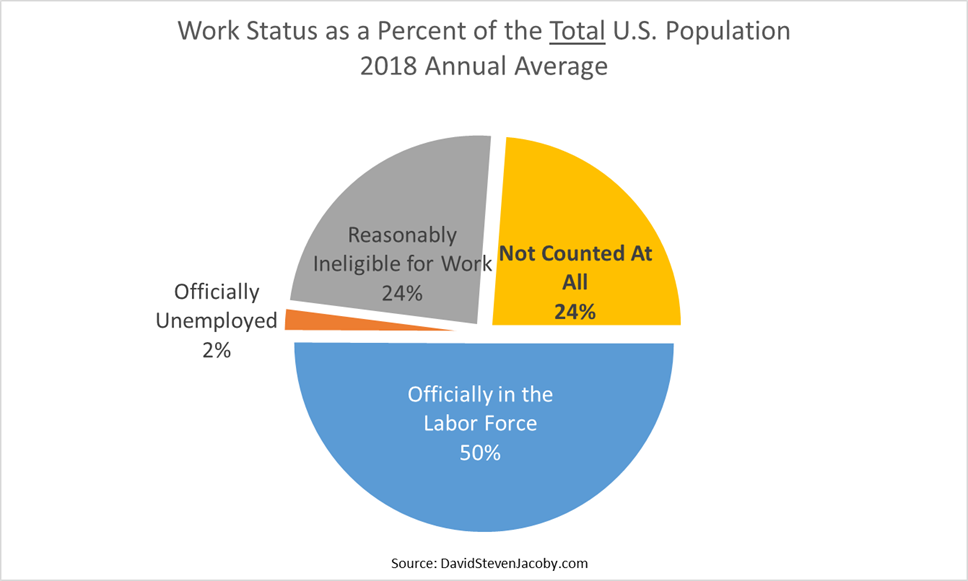
Unemployment is an important component of GDP-a, so measurement accuracy is important. Sometimes adjustments are needed to improve the accuracy of national statistics. The U.S. Bureau of Labor Statistics (BLS) publishes a widely cited unemployment rate (called U3) that fails to account for one out of every three people who are ready and willing to work. For example, those who haven’t worked for the last four weeks are not counted in the labor force. Neither are the poor and homeless who don’t self-report, discouraged workers who have stopped looking for a job, long-term unemployed (more than four weeks), the underemployed, unemployed gig workers, and others. These groups make up 78 million people, or 24% of the U.S. population, as shown in the chart below.
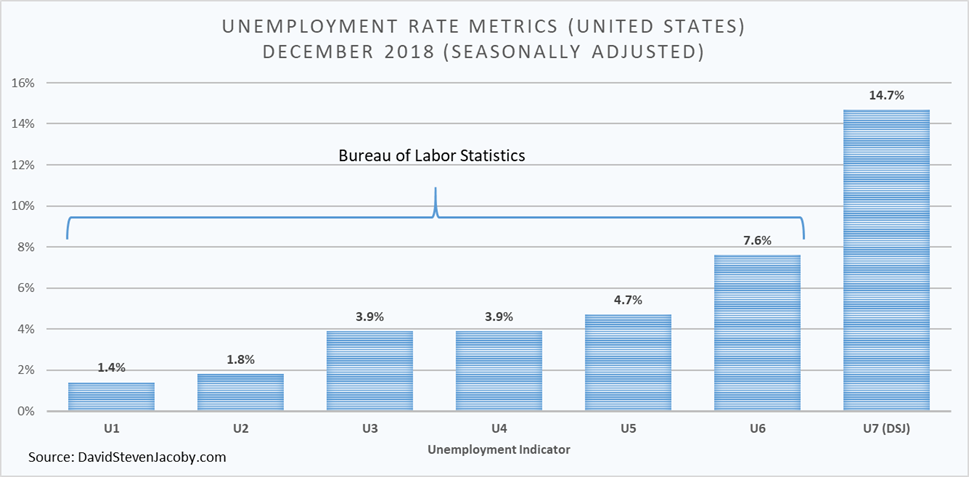
BLS publishes six variations on the unemployment rate, named U1 through U6, which ranged from 1.4% to 7.6% of the official civilian workforce in 2018, with the U3 being the most widely reported. While the U3 rate, which at 3.9% for 2018 seems to fall in the middle and thereby be a trustworthy estimate, the actual rate was 14.7% (as shown in the chart below) after poor non-respondents, the homeless, the underemployed, unemployed gig workers, discouraged workers, long-term unemployed, and other capable groups are counted in the eligible labor force. It is also worth mentioning that BLS counts anybody who works more than one hour a week as employed.
The largest group of groups outside the official labor pool consists of poor people who don’t report to the BLS that they are either working or not working, perhaps because they don’t have a registered phone or a fixed address. The second largest group is underemployed gig workers. The third is discouraged workers who have stopped searching for work. The fourth is workers who haven’t filed for unemployment in the previous six weeks. Finally, prisoners for whom employment might be beneficial and/or rehabilitative are not counted, which normally might be of debatable significance except that the U.S., with the highest incarceration rate in the world, has the highest number of prisoners per capita in the world (as of 2015). The chart below shows the breakdown of uncounted labor in the official “labor force.”