GDP-a Data
Please see below sample data for India, Switzerland, the United States, and the World, and a data order form that we are using until web download is enabled.
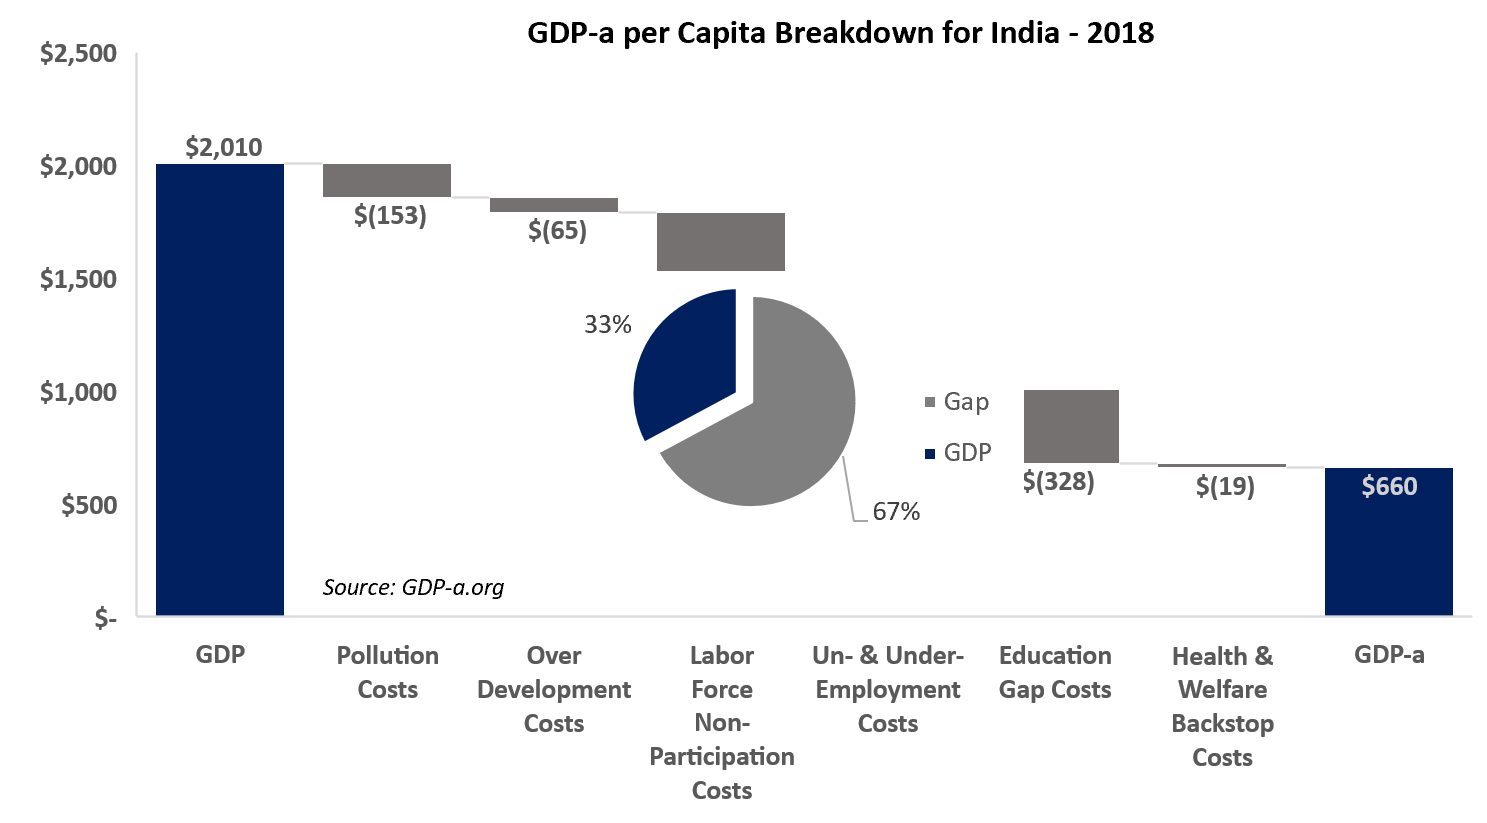
India: Composition of GDP vs. GDP-a (snapshot)
- Indian GDP-a was 67% lower than GDP in 2018 due to structural labor force and educational challenges.
- Only half (52.1%) of people participate in the labor force, and 81.2% are “informally” employed. This leaves most of the society without benefits or social safety nets.
- Only 74% of the population is literate, which restrains economic growth.
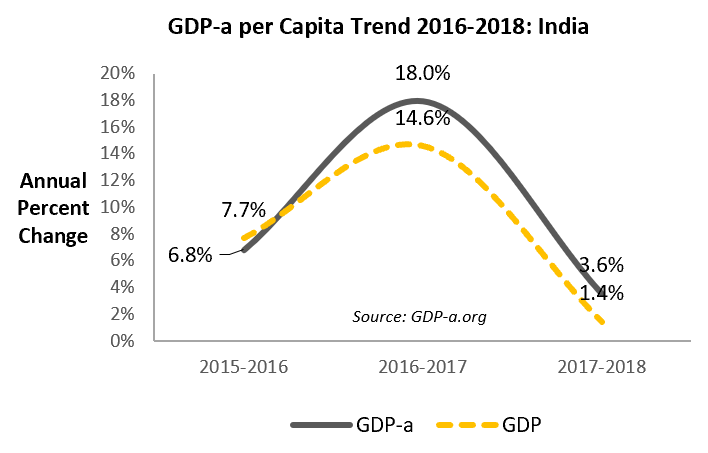
India: GDP-a Trend (snapshot)
- Indian GDP and GDP-a both rose sharply in 2017 as GDP jumped by 14.6% and fell in 2018 as GDP growth dropped to 1.4%.
- GDP-a rose more than GDP, mostly in 2017, because workers’ average monthly earnings jumped by 9.7%.
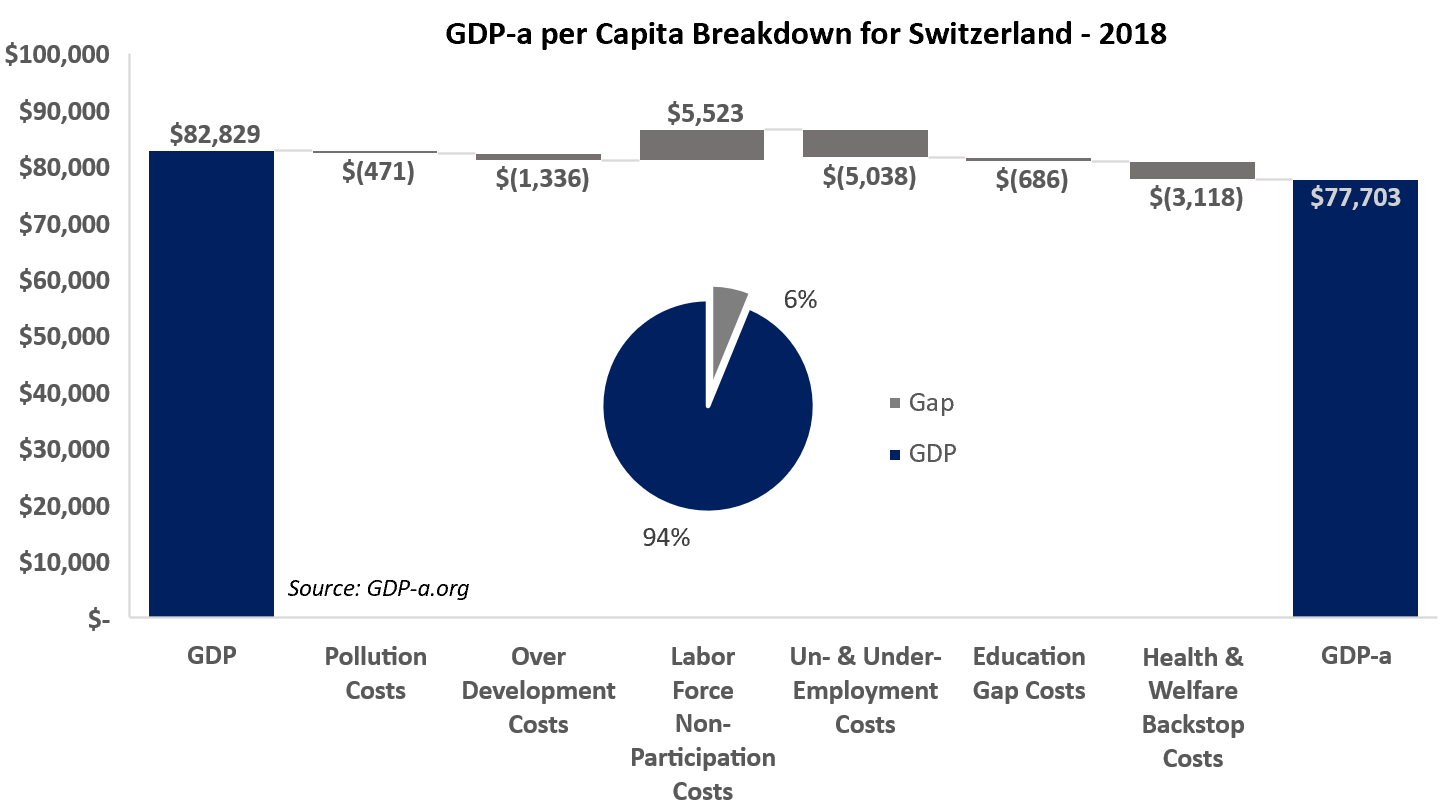
Switzerland: Composition of GDP vs. GDP-a (snapshot)
- Swiss GDP-a was only 6% lower than GDP in 2018.
- Unemployment was extremely low at 4.7%, representing broad-scale shared economic activity.
- Since 84.2% of the eligible people participate in the labor force (among the highest participation rates in the world), gainful economic activity was broadly diffused across the population. This equality of economic growth drove GDP-a up by 6.7% more than GDP.
- Swiss society is highly literate (99%), green (low CO2 emissions), and socially healthy (low public health backstop expenditures), each of which contributed to the minimal gap between GDP and GDP-a.
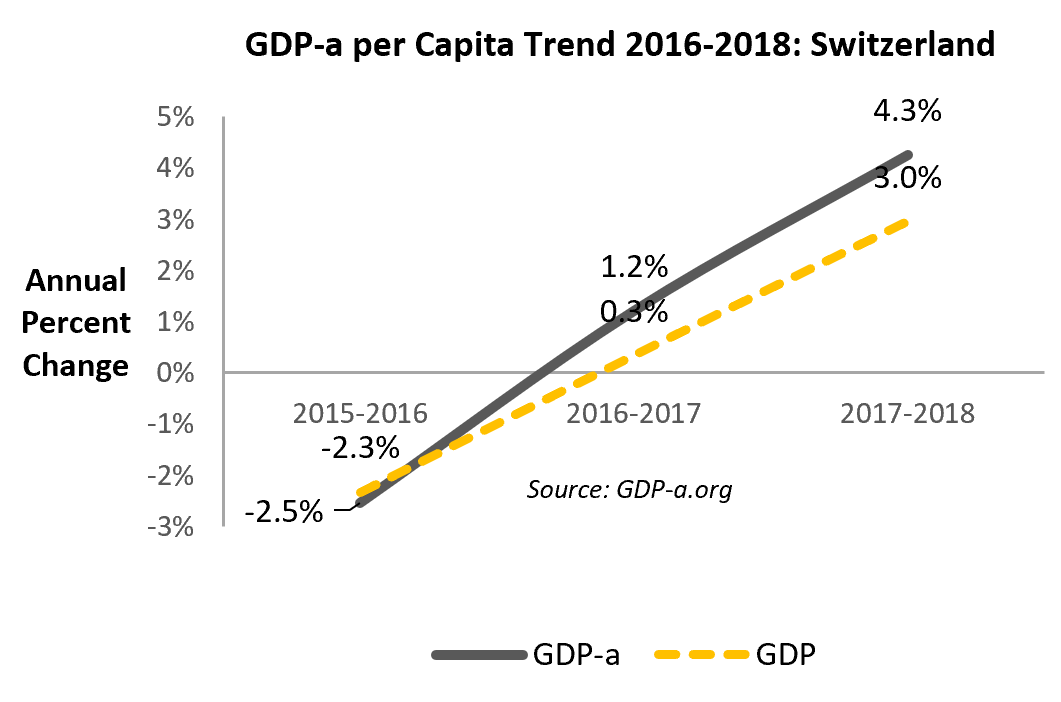
Switzerland: GDP-a Trend (snapshot)
- Swiss GDP-a rose by 4.4% in 2018.
- GDP-a slightly outperformed GDP (1.4% higher than GDP in 2018) due to increasing engagement of the labor force. Labor force participation rose 0.2%, unemployment fell by 0.1%, and the rate of self-employment declined by 0.2%.
- Fatalities due to water contamination decreased by 2.1% between 2016 and 2018, bumping GDP-a upward for 2018.
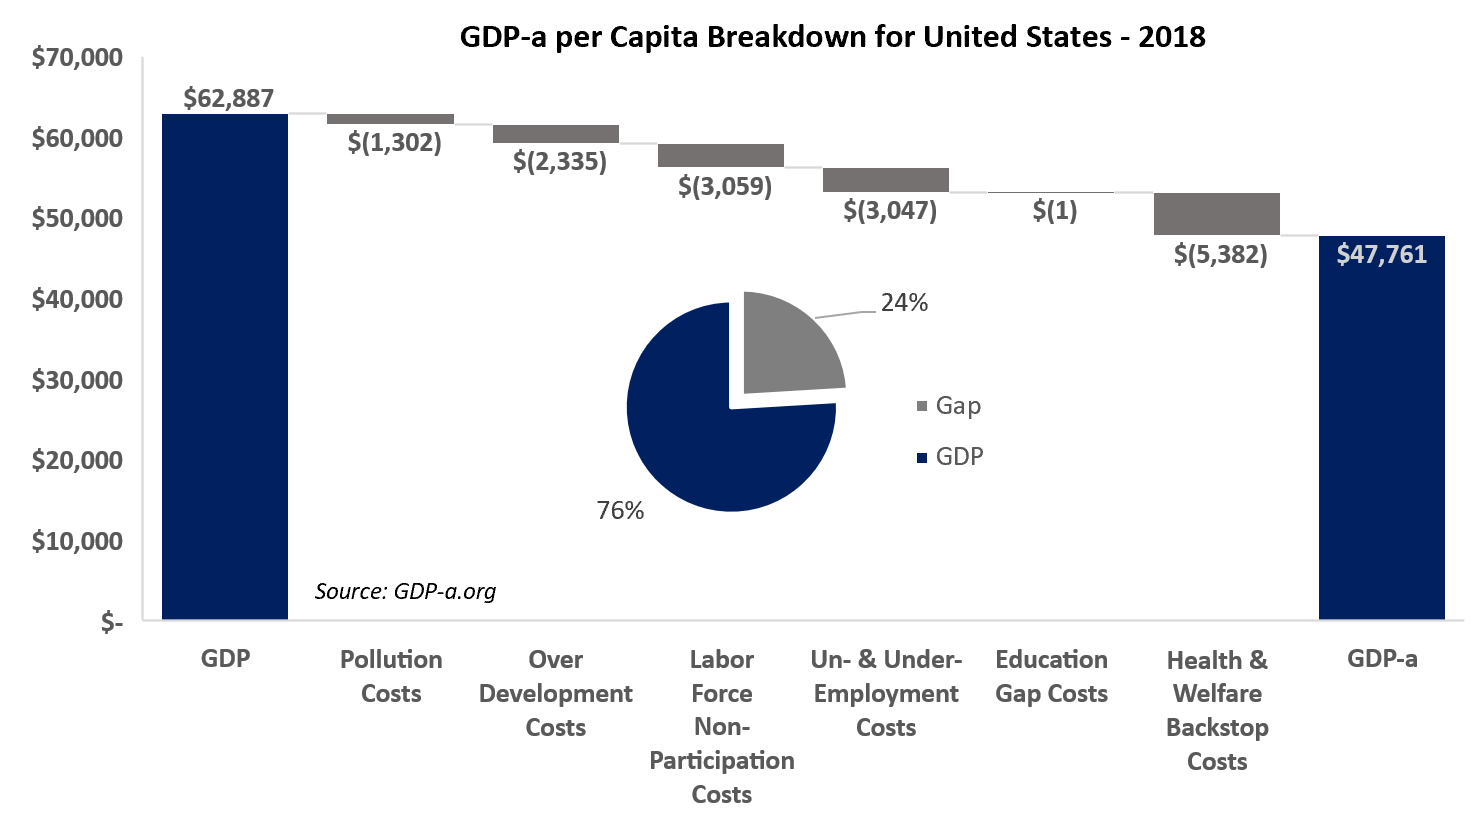
United States: Composition of GDP vs. GDP-a (snapshot)
- US GDP-a was 24% lower than GDP in 2018, mostly due to the fragility of the labor market and the cost of the resulting public social and health problems, including unequal access to opportunity, poverty, and mental illness.
- Rising informal employment (“the gig economy”), which has risen from 13% to 18% between 2015 and 2018, obscures the true unemployment rate. The effect of rising informal employment was partially offset by declining official unemployment, which fell from 5.3% to 3.9% between 2015 and 2018.
- Public Medicaid costs, which serve as a backstop for the poor, stood at 8.6% of GDP in 2015, indicating substantial poverty and displaced productive resources that could otherwise be used for investment or tax cuts.
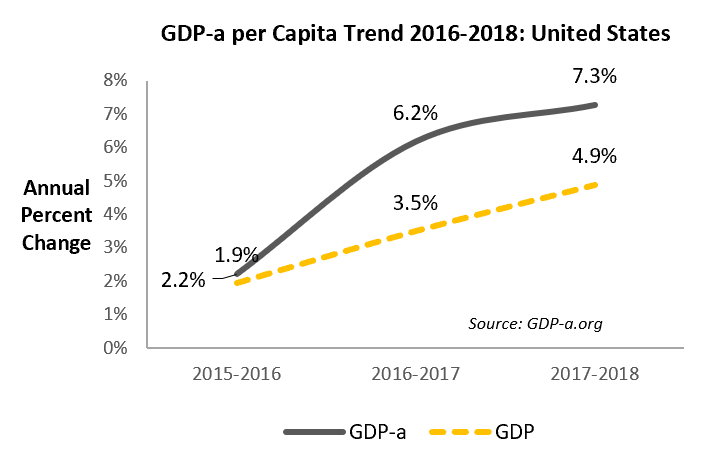
United States: GDP-a Trend (snapshot)
- While US GDP rose by 8.6% between 2015 and 2018, GDP-a rose 13.9%, reflecting positive social and environmental developments:
- 2.7 million jobs were created.
- Average monthly earnings rose 3.3% in 2017.
- CO2 emissions per capita dropped by 2.9%, from 16.9 to 16.0 metric tons per capita.
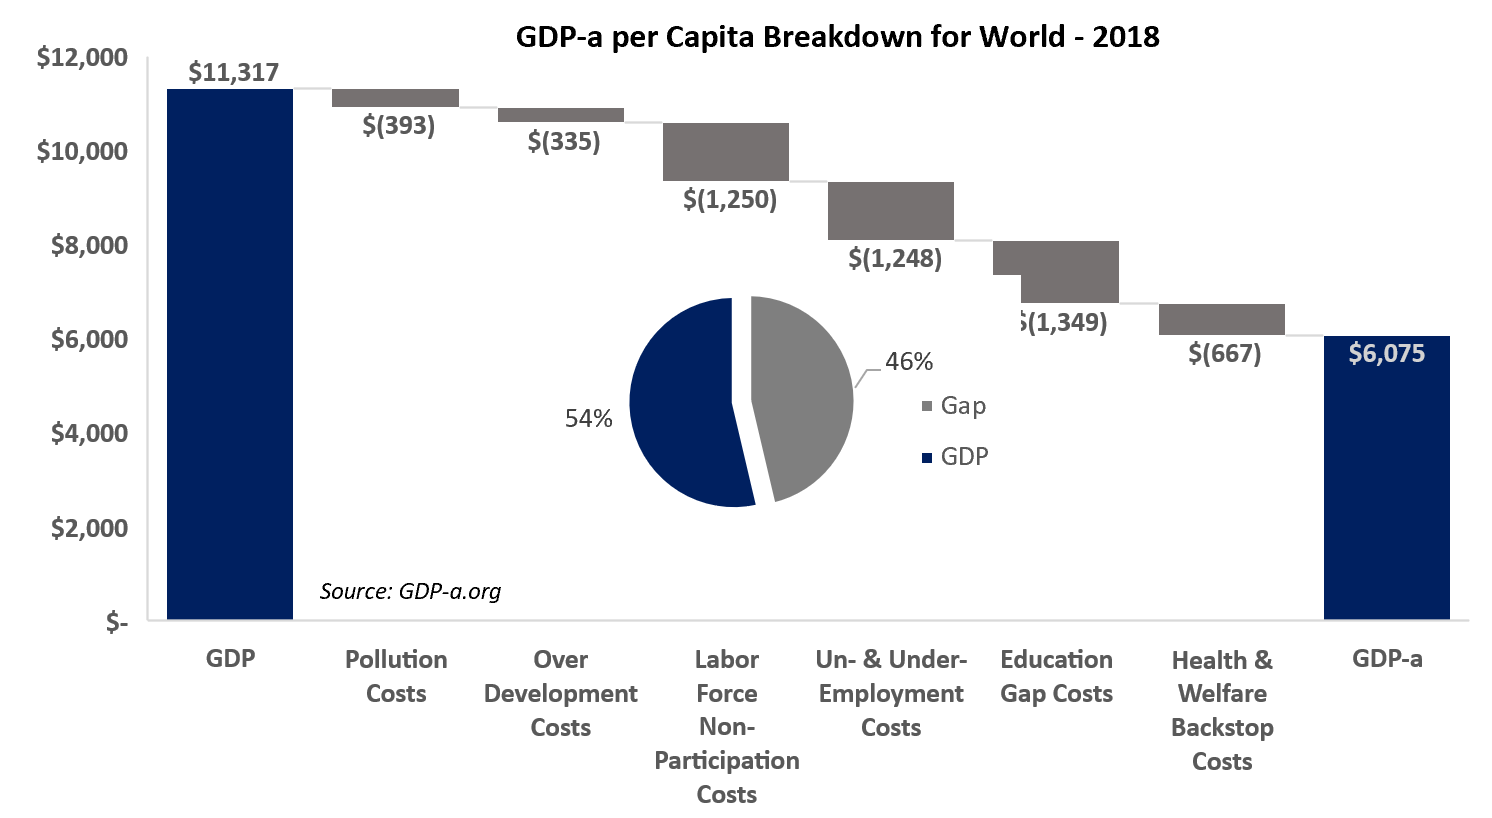
World: Composition of GDP vs. GDP-a (snapshot)
- Globally, GDP-a was 45% lower than GDP in 2018.
- Low labor force participation (66.5%), high rates of informal employment (57.2%) and self-employment (47.3%), illiteracy (14%), and health & welfare backstop costs (5.9% of GDP) were responsible for the wide gap between GDP and GDP-a .
- In 2017, GDP-a around the world rose by 8.3%, while GDP rose by 5.1%.
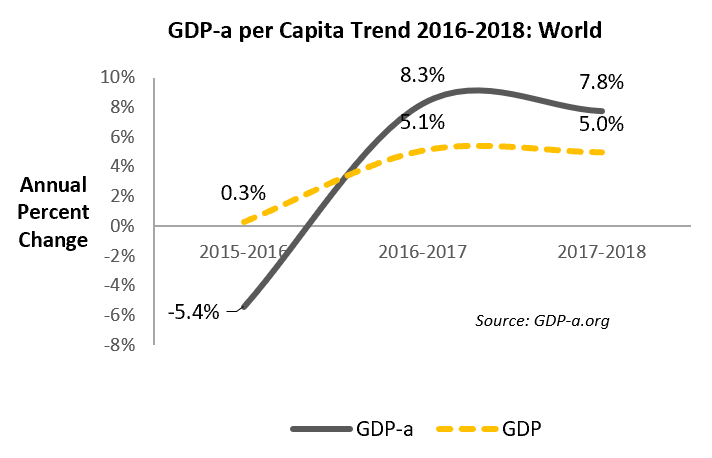
World: GDP-a Trend (snapshot)
- World GDP-a rose more than GDP mostly during the 2016-2018 period due to labor markets.
- Unemployment fell by 1.8%, informal employment fell by 2.1% and labor force participation rose by 0.9%.
- Minimum wages rose by an average of 2.0%, creating better opportunities for those at the low end of the pay scale. All this happened despite the fact that the over-65 population rose by 0.2%. So, economic growth generally became more inclusive in 2017.
- However, average wages declined by 1.9% as more people competed for the jobs, and 0.2% of 0.4% of fish, mammal, plant, and bird species became extinct as deforestation continued a consistent march.
- The social and environmental benefits began to erode in 2018. GDP-a rose by 7.5% while GDP rose by 5.0%. The difference between financial growth and social and environmental externalities is more visible in the GDP-a than in the GDP.
- While the financial growth continued, labor gains began to fade. Informal employment rose by 2.7% instead of falling. Minimum wages rose by only 0.3%.
- Meanwhile, CO2 emissions continued to rise by 0.2%, deforestation and loss of biodiversity continued.
To order data, complete the data request form below.
Commonly requested data requests include:
- GDP-a time series downloads
- 2018-2020 Backcast
- 2010-2018 Backcast
- 2020-2030 Forecast
- Custom regions, clusters, states or districts
- Policy scenarios
The GDP-a Institute updates, extends, backfills, and customizes the GDP-a metric and its components to meet your requirements. Ask us for what you need.